


 Feed
Feed Scan with QR Code Reader
 mobi
mobi- Advertise / Donate
Welcome !
Newquay weather receives over 1000 vistors per day winter time, rising to over 3000 to 4000 or more in the summer, including visitors from all over the world.
Please help support this site

Your business

Via Paypal
- Accommodation
Hotels, B&B's and Caravan and Camping Sites

Porth Sands - Luxury beach accommodation wth beach facing balconies, a golden sandy beach making it the perfect place to idle away the hours- swimming, body boarding, sunbathing and paddling.
- Food
Restaurants, Cafe's, Takeaways

Pachanga - Pachanga Authentic Mexican Since 2016 we've been re-creating dishes that are part of our cultural heritage using techniques that are unique to Mexico. We use mostly Mexican, local & organic produce in our dishes & drinks
- Charity Events
Charity Events - Max 3 free ads
For a Free Charity Ad Here, please contact me- - Houses for Sale
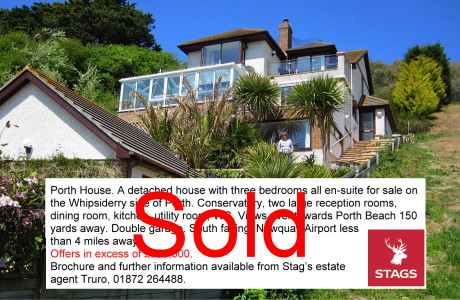
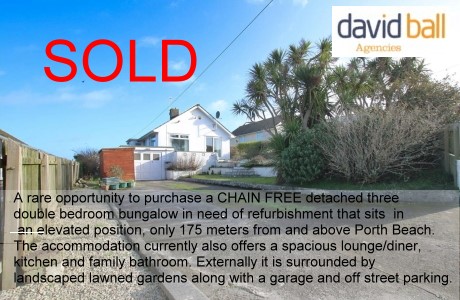
Houses for Sale
Advertise your house for sale here and help support this site.
Small photo, text + link to agents for a One off ₤25. Please contact me.Advertise your house for sale here
- Local Services
Shops, Services etc

Towan Insurance BrokersCornwall's local commercial insurance specialist. We help Cornish businesses find the right cover, from tradespeople and property owners to specialist contractors. Based in Cornwall, independent, and genuinely invested in the businesses we work with. Visit us at Towan Insurance Brokers
| Weather Warnings |
|
|
|
|
| Newquay Weather Webcams |

|

|

|
| Timelapse Last 8 images Both Cams | Cam 2 Last 8 images | Last 8 images |

|

|

|
| Timelapse Last 8 images Images | Snaps update every 10/10/15/15 mins. | Webcams Updated 27/06/2020 - falriver ferries |
| Newquay Weather Latest News |
| Whats New or Important |
12-07-2026 - Updated the NASA Epic Imagery webpage, back online
11-07-2026 - Station high temperture record broken again, new record 32.9 C at 13:50
10-07-2026 - Updated the NOAA Image of the Day Script and added NASA Earth Observatory Natural Events Tracker
25-06-2026 - Station high temperture record broken, new record 32.6 C at 15:53 (old record 32.4 C on 12-08-2022)
|
METRIC |
IMPERIAL
|
Updated: 02/08/2026 @ 21:30 (0 sec ago) | ||||||||||||||||||||||||||||||||||||||||||||||||||||||||||||||||||||||||
| Temperature | Current Conditions |
Forecast / Rain Radar | |||||||||||||||||||||||||||||||||||||||||||||||||||||||||||||||||||||||
|
|
|
|||||||||||||||||||||||||||||||||||||||||||||||||||||||||||||||||||||||
| Dew Point | Liquid Precipitation | Wind Speed | Sun/Moon | ||||||||||||||||||||||||||||||||||||||||||||||||||||||||||||||||||||||
|
|
|
|
||||||||||||||||||||||||||||||||||||||||||||||||||||||||||||||||||||||
| Humidity | Barometer | ||||||||||||||||||||||||||||||||||||||||||||||||||||||||||||||||||||||||
|
|
||||||||||||||||||||||||||||||||||||||||||||||||||||||||||||||||||||||||
| Heating Degree Days | Snow3 | Wind Chill | Newquay Radiation | ||||||||||||||||||||||||||||||||||||||||||||||||||||||||||||||||||||||
|
|
|
|
||||||||||||||||||||||||||||||||||||||||||||||||||||||||||||||||||||||
| UV Summary/Forecast | Current Solar Energy9 | ||||||||||||||||||||||||||||||||||||||||||||||||||||||||||||||||||||||||
|
|
||||||||||||||||||||||||||||||||||||||||||||||||||||||||||||||||||||||||
| Almanac | Irrigation Index5 | Station All Time Records | Cloud Level | ||||||||||||||||||||||||||||||||||||||||||||||||||||||||||||||||||||||
|
|
|
|
||||||||||||||||||||||||||||||||||||||||||||||||||||||||||||||||||||||


| # WIND - Sheltered position when wind blows from SE through S to SW. 1 Rain season: Jan 1st to Dec 31st. 2 Snow season July 1st to June 30th. 3 Snow manually measured usually around 7AM and 7PM. 5 Estimated amount of water needed to replace the water used by plants and evaporation from the past week. (Negative numbers mean amount of water needed, positive numbers mean excess water is present). 6 Sun Spots - Data from WDC-SILSO, Royal Observatory of Belgium, Brussels. 9 Solar Index represents either an absolute scale of solar energy (W/m²) using the station’s recorded maximum or a percentage of computed theoretical solar maximum using the station’s location and time of day. These indices differ most when the sun is low on the horizon. The current scale is shown, and will toggle if it or the icon is clicked. 10 Historical average only to day 2 of just the month of August for this station since 2008. 11 Historical average rain this season to day 2 of August for this station since 2008. |
| Aerisweather Weather Forecast - Outlook Sunday night & Monday | |||||||||||||||||||||||||||||||||||||||||||||||||||||||||||||||||||||||||||||||
|
|||||||||||||||||||||||||||||||||||||||||||||||||||||||||||||||||||||||||||||||
|
|||||||||||||||||||||||||||||||||||||||||||||||||||||||||||||||||||||||||||||||
|
|||||||||||||||||||||||||||||||||||||||||||||||||||||||||||||||||||||||||||||||
|
ajax-dashboard6.php - Version 6.95h - 20-Feb-2023 - Script by: Scott of BurnsvilleWeatherLIVE.com Now supported by Saratoga-weather.org Download |
|||||||||||||||||||||||||||||||||||||||||||||||||||||||||||||||||||||||||||||||