Aurora Borealis Forecast / Watch

Data supplied curtesy of Space Weather Prediction Center, NOAA NOAA Ovation
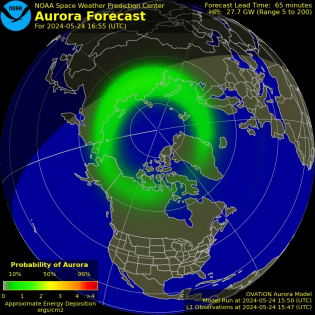
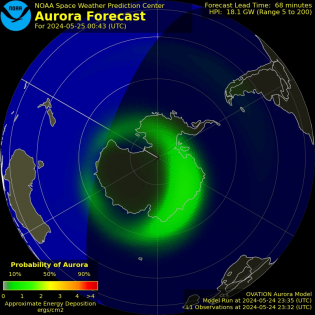
The sunlit side of Earth is indicated by the lighter blue of the ocean.
The day-night line or terminator is shown as a yellow line. Note that
the Aurora will not be visible during daylight hours and it may be an
hour or more before sunrise or after sunset that the aurora can be seen from the ground.
The red line about 1000 km equatorward of the aurora indicats how far away viewers on the ground might see the aurora assuming good viewing conditions.
The aurora is a dynamic and visually delicate manifestation of solar-induced geomagnetic storms. The solar wind energizes electrons and ions in the magnetosphere. These particles usually enter the Earth’s upper atmosphere near the polar regions. When the particles strike the molecules and atoms of the thin, high atmosphere, some of them start to glow in different colors. Aurora begin between 60 and 80 degrees latitude. As a storm intensifies, the aurora spread toward the equator. During an unusually large storm in 1909, an aurora was visible at Singapore, on the geomagnetic equator.
The aurora provide pretty displays, but they are just a visible sign of atmospheric changes that may wreak havoc on technological systems such as satellites, navigation, radio communications and electrical power lines, other effects can be seen in climate and pipelines plus there is growing evidence indicating that changes in the geomagnetic field affect biological systems.
Auroral Activity Extrapolated from NOAA POES
Northern Hemi Auroral Map
|
Southern Hemi Auroral Map
|
Instruments on board the NOAA Polar-orbiting Operational Environmental Satellite
(POES) continually monitor the power flux carried by the protons and electrons that
produce aurora in the atmosphere. SWPC has developed a technique that uses the power
flux observations obtained during a single pass of the satellite over a polar region
(which takes about 25 minutes) to estimate the total power deposited in an entire polar
region by these auroral particles.
The power input estimate is converted to an auroral activity index that ranges from 1 to 10.
The power input estimate is converted to an auroral activity index that ranges from 1 to 10.


 Feed
Feed Scan with QR Code Reader
 mobi
mobi


