Auroara Activity -Northern Hemisphere
From the most recent NOAA POES satellite pass. The red arrow in the plot, points toward the noon meridian.
The power fluxes are color coded on a scale from 0 to 10 ergs .cm-2.sec-1 according to the color bar on the right, updated every ten minutes.
| Solar X-rays: Geomagnetic Field: |
Solar in more detail
- Click to view SOHO Home Page Updated every 60 minutes
- Just click on the link below the image to open the corresponding animated gif or mpg file (mpgs are smaller) to show the image in elapsed time.
- The gif files are LARGE
- Check out the sunspot page here.
What is CCD bakeout
If the images shown above display the message 'CCD BAKEOUT', there is nothing
wrong with SOHO's EIT instrument, it is taken off line in order to maintain the performance
of the instrument. The images will resume within 2-3 weeks. For more information
go here
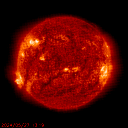
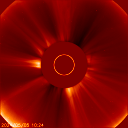
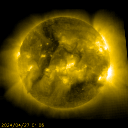
| Current_eit_304 | Current_c2 | Current_eit_284 | Current mdi_igr |
 |
 |
 |
 |
| Animated gif | Animated gif | Animated gif |
| Current Solar Wind | Current Northern Auroral | Current Southern Auroral | ||
 |
 |
 |
 |
- EIT (Extreme ultraviolet Imaging Telescope) images the solar atmosphere at several wavelengths, and therefore, shows solar material at different temperatures. In the images taken at 304 Angstrom the bright material is at 60,000 to 80,000 degrees Kelvin. In those taken at 171 Angstrom, at 1 million degrees. 195 Angstrom images correspond to about 1.5 million Kelvin, 284 Angstrom to 2 million degrees. The hotter the temperature, the higher you look in the solar atmosphere.
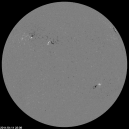
- The MDI (Michelson Doppler Imager) images shown here are taken in the continuum near the Ni I 6768 Angstrom line. The most prominent features are the sunspots. This is very much how the Sun looks like in the visible range of the spectrum (for example, looking at it using special 'eclipse' glasses: Remember, do not ever look directly at the Sun!. The magnetogram image shows the magnetic field in the solar photosphere, with black and white indicating opposite polarities.
- The C2 image shows the inner solar corona up to 8.4 million kilometers (5.25 million miles) away from the Sun.
Visit SOHO Explore to learn more about the Sun.
Eclipses
Solar and Lunar Eclipses 2025 here
Solar and Lunar Eclipses 2024 here
Solar and Lunar Eclipses 2023 here
Solar and Lunar Eclipses 2022 here
Solar and Lunar Eclipses 2021 here
Solar and Lunar Eclipses 2020 here
Solar and Lunar Eclipses 2019 here
Solar and Lunar Eclipses 2018 here
Solar and Lunar Eclipses 2017 here
Solar and Lunar Eclipses 2016 here
Solar and Lunar Eclipses 2015 here
Eclipse Predictions by Fred Espenak, NASA's GSFCRemember, do not look directly at the Sun.
There are four types of solar eclipses:
- A total eclipse occurs when the Sun is completely obscured by the Moon. The intensely bright disk of the Sun is replaced by the dark silhouette of the Moon, and the much fainter corona is visible. During any one eclipse, totality is visible only from at most a narrow track on the surface of the Earth.
- An annular eclipse occurs when the Sun and Moon are exactly in line, but the apparent size of the Moon is smaller than that of the Sun. Hence the Sun appears as a very bright ring, or annulus, surrounding the outline of the Moon.
- A hybrid eclipse (also called annular/total eclipse) transitions between a total and annular eclipse. At some points on the surface of the Earth it is visible as a total eclipse, whereas at others it is annular. Hybrid eclipses are comparatively rare.
- A partial eclipse occurs when the Sun and Moon are not exactly in line and the Moon only partially obscures the Sun. This phenomenon can usually be seen from a large part of the Earth outside of the track of an annular or total eclipse. However, some eclipses can only be seen as a partial eclipse, because the umbra never intersects the Earth's surface, passing above or below the Earth's polar regions.


 Feed
Feed Scan with QR Code Reader
 mobi
mobi