Solar radiation and photovoltaic electricity potential - UK, Europe and the World
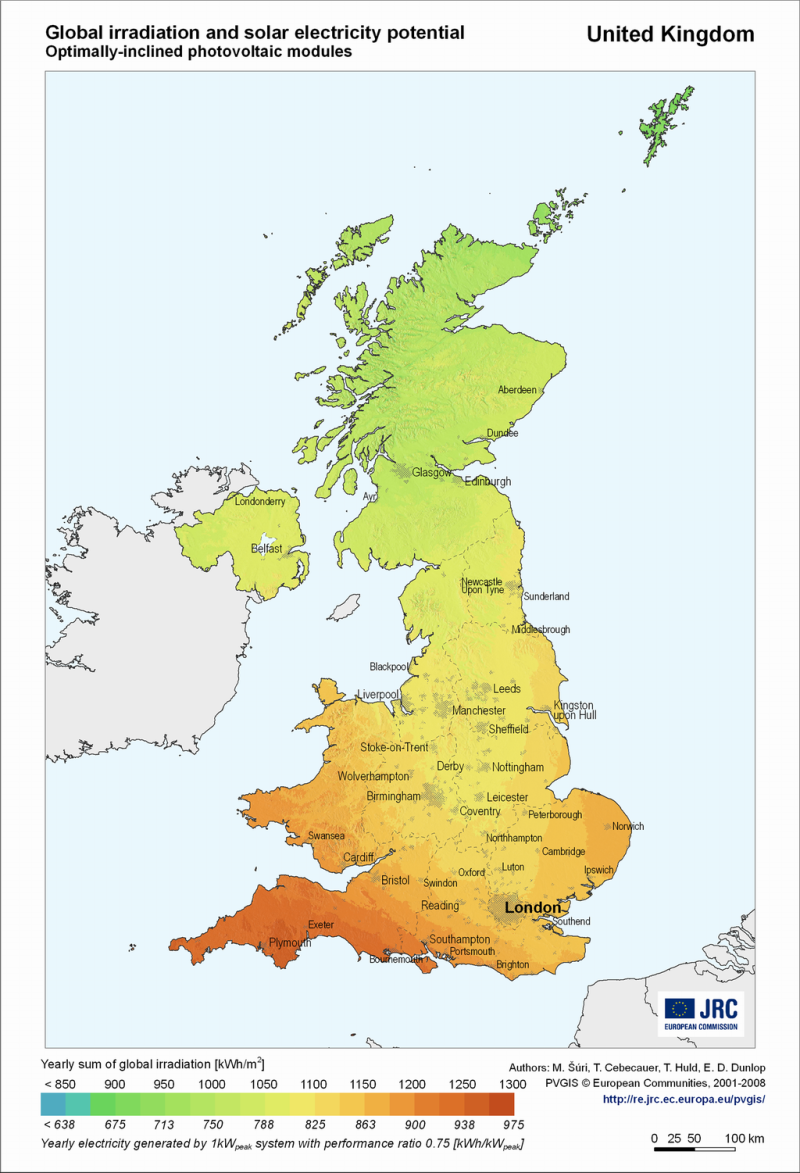
The PVGIS map represent yearly sum of global irradiation on horizontal and optimally inclined surface,
10-years average of the period 1981-1990 [kWh/m2]. The same colour legend represents also
potential solar electricity [kWh/kWp] generated by a 1 kWp system per year with photovoltaic
modules mounted at an optimum inclination and assuming system performance ratio 0.75.
More country maps here PVGIS © European
Communities, 2001-2008
Irradiance [W/m2]: The intensity of solar radiation hitting a surface, which is the sum of the contributions of all wavelengths within the spectrum, expressed in units of Watts per m2 of a surface.
Irradiance [W/m2]: The intensity of solar radiation hitting a surface, which is the sum of the contributions of all wavelengths within the spectrum, expressed in units of Watts per m2 of a surface.

Irradiation map from PVGIS
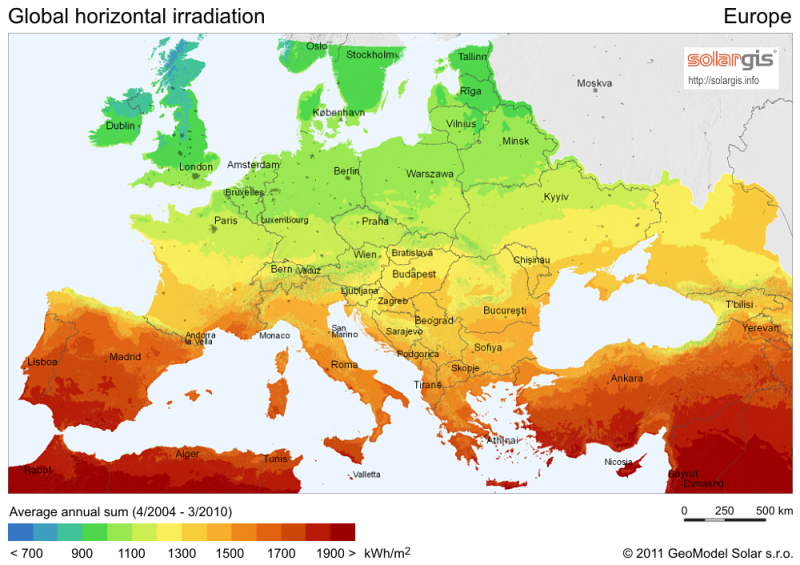
Europe

Horizontal irradiation map from SolarGIS
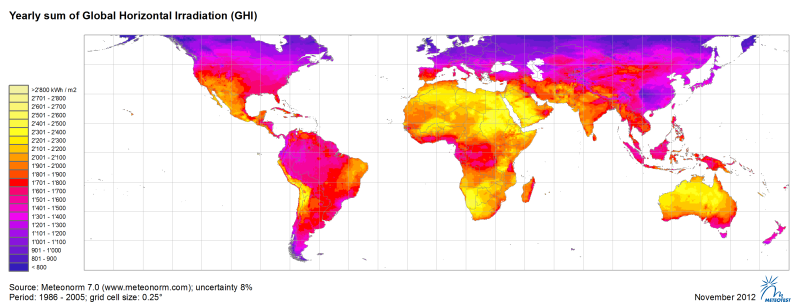
World

© METEOTEST; based on www.meteonorm.com


 Feed
Feed Scan with QR Code Reader
 mobi
mobi


