


 Feed
Feed Scan with QR Code Reader
 mobi
mobi- Advertise / Donate
Welcome !
Newquay weather receives over 1000 vistors per day winter time, rising to over 3000 to 4000 or more in the summer, including visitors from all over the world.
Please help support this site

Your business

Via Paypal
- Accommodation
Hotels, B&B's and Caravan and Camping Sites

Porth Sands - Luxury beach accommodation wth beach facing balconies, a golden sandy beach making it the perfect place to idle away the hours- swimming, body boarding, sunbathing and paddling.
- Food
Restaurants, Cafe's, Takeaways

Pachanga - Pachanga Authentic Mexican Since 2016 we've been re-creating dishes that are part of our cultural heritage using techniques that are unique to Mexico. We use mostly Mexican, local & organic produce in our dishes & drinks
- Charity Events
Charity Events - Max 3 free ads
For a Free Charity Ad Here, please contact me- - Houses for Sale
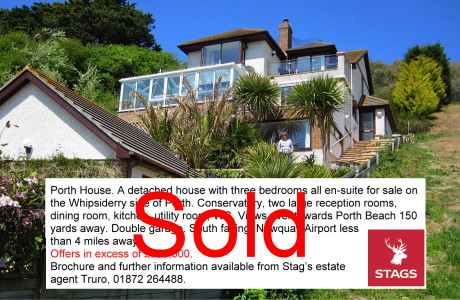
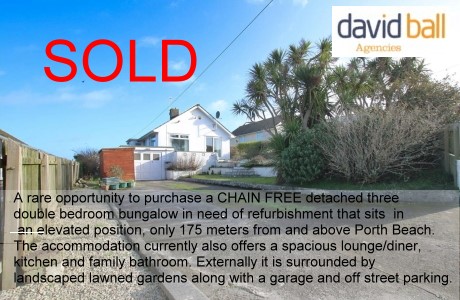
Houses for Sale
Advertise your house for sale here and help support this site.
Small photo, text + link to agents for a One off ₤25. Please contact me.Advertise your house for sale here
- Local Services
Shops, Services etc
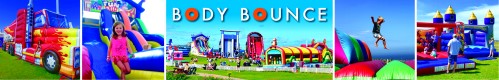
Body BounceBody Bounce bouncy castle park in Newquay. Great fun, fantastically priced and we are open during the warmer months weather depending. (Postcode for SATNAV: TR7 2QF). Body Bounce also provides private bouncy castle hire. Check out our full range at Body-Bounce
Earthquake Facts and Statistics
Plate Tectonics
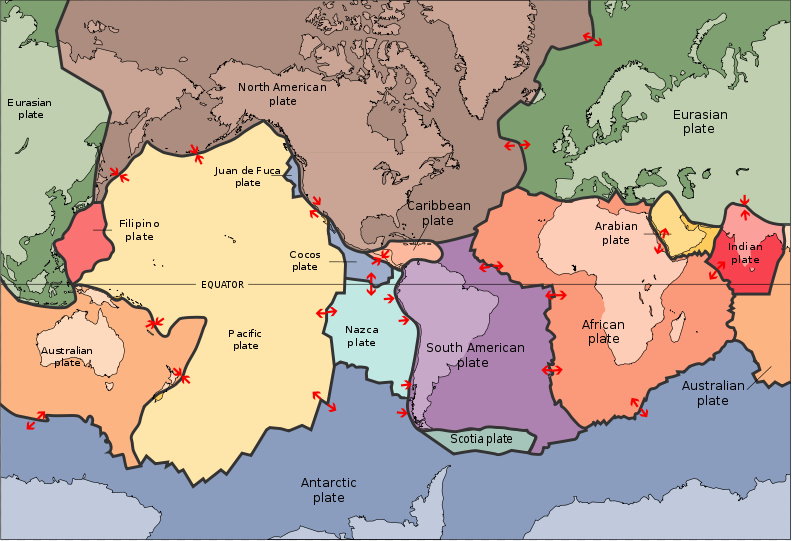
Plate Tectonics Map by USGS
There are six major plates, named for the continents embedded within them, such as the North American, African, and Antarctic plates and dozens of smaller, or minor, plates. The plates make up Earth's outer shell, called the lithosphere. Churning currents in the molten rocks below propel them along like a jumble of conveyor belts. The movement of the plates creates three types of tectonic boundaries: convergent, where plates move into one another; divergent, where plates move apart; and transform, where plates move sideways in relation to each other.
Convergent Boundaries
Where plates serving landmasses collide, the crust crumples and buckles into mountain ranges.
India and Asia crashed about 55 million years ago, slowly giving rise to the Himalaya
Divergent Boundaries
In the oceans, magma from deep in the Earth's mantle rises toward the surface and pushes apart two or more plates. Mountains and volcanoes rise along the seam
On land, giant troughs such as the Great Rift Valley in Africa form where plates are tugged apart.
Transform Boundaries
The San Andreas Fault in California is an example of a transform boundary, where two plates grind past each
other along what are called strike-slip faults
Check out the list of magnitude 8 and greater earthquakes since 1900, Here
March 2011, Japan's coastline may have shifted by as much as 4m (13ft) to the east following the 8.9 Magnitude earthquake on friday 11th, according to experts also the quake probably shifted Earth on its axis by about 6.5 inches (16.5cm) and caused the planet to rotate somewhat faster, shortening the length of the day by about 1.8 millionths of a second.
Earthquake Statistics
Number of Earthquakes Worldwide for 2000 - 2011
Located by the US Geological Survey National Earthquake Information Center
Last updated 15th March 2011| Magnitude | 2000 | 2001 | 2002 | 2003 | 2004 | 2005 | 2006 | 2007 | 2008 | 2009 | 2010 | 2011 |
|---|---|---|---|---|---|---|---|---|---|---|---|---|
| 8.0 to 9.9 | 1 | 1 | 0 | 1 | 2 | 1 | 2 | 4 | 0 | 1 | 1 | 1 |
| 7.0 to 7.9 | 14 | 15 | 13 | 14 | 14 | 10 | 9 | 14 | 12 | 16 | 21 | 11 |
| 6.0 to 6.9 | 146 | 121 | 127 | 140 | 141 | 140 | 142 | 178 | 168 | 144 | 151 | 128 |
Frequency of Occurrence of Earthquakes
| Magnitude | Average Annually |
|---|---|
| 8 and higher | 1 ¹ |
| 7 - 7.9 | 15 ¹ |
| 6 - 6.9 | 134 ² |
| 5 - 5.9 | 1319 ² |
| 4 - 4.9 | 13,000 (estimated) |
| 3 - 3.9 | 130,000 (estimated) |
| 2 - 2.9 | 1,300,000 (estimated) |
¹ Based on observations since 1900.
² Based on observations since 1990.
