Tesla Powerwall
| Graph Key |
Data collected every minute |
| Time - Lastest data, collected every minute |
Solar - Generation, Watts |
| Grid - Import (+ve) / Export (-ve), Watts |
Powerwall - Charge (-ve), Discharge (+ve), Watts |
| Home - Usage, Watts |
Battery - Percentage charge |
Tesla Powerwall Latest Data
Time
Solar (W)
Home (W)
Grid (W)
Powerwall (W)
Battery (%)
19:53:02
93
614
13
510
27.56
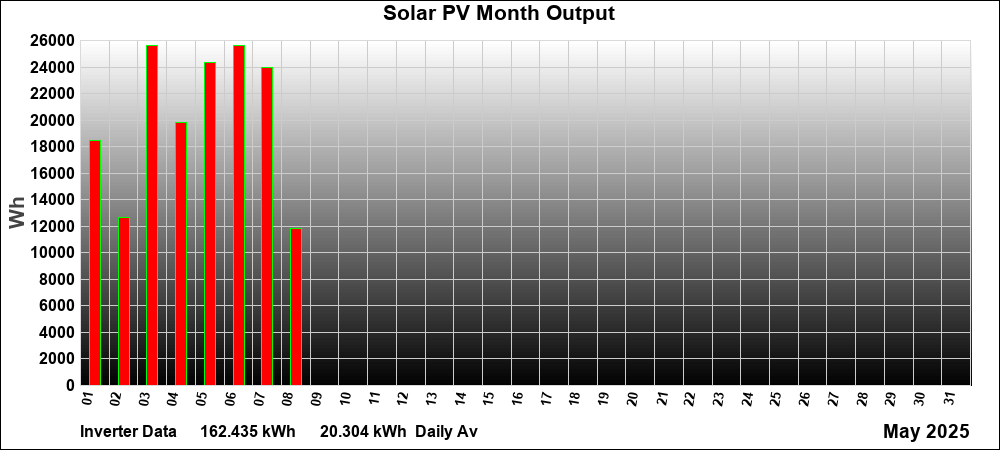
Tesla Powerwall Today's Meter Totals
Todays Date
Solar Gen (kWh)
Home Usage (kWh)
Grid Import (kWh)
Grid Export (kWh)
Battery Discharge (kWh)
Battery Charge (kWh)
08-05-2025
11.677
16.347
0.7
0.423
7.88
3.476
Days With No Grid Usage - Data from smart meter
18-06-2024
28-06-2024
29-07-2024
13-09-2024

Tesla Data - Grid Usage By Month
Month
E7 Rate (pence per kwh)
kwh Used
Cost £
Total For Month
May 2025
Night 6.7p
19.3
1.29
£ 1.55
Up to 07 May 2025
Day 25.872p
1.0
0.26
April 2025
Night 6.7p
260.2
17.43
£ 34.40
March 2025 # E-on
Night 6.7p
242.8
16.27
£ 20.25
From 06 March 2025
Day 25.872p
15.4
3.98
March £ 23.53
March 2025
Night 13.28p
23.8
3.16
£ 3.28
Up to 05 March 2025
Day 30.87p
0.4
0.12
February 2025 # E-on
Night 13.28p
103.5
13.74
£ 14.94
From 20 February 2025
Day 30.87p
3.9
1.20
February £ 47.48
February 2025
Night 10.90p
272.8
29.74
£ 32.54
Up to 19 February 2025
Day 27.98p
10.0
2.80
- £3.36 EDF Free
January 2025
Night 10.90p
457.2
49.83
£ 64.91
Day 27.98p
53.9
15.08
- £5.49 EDF Free
December 2024
Night 10.90p
473.7
51.63
£ 76.64
November 2024
Night 10.90p
457.4
49.86
£ 59.07
October 2024
Night 10.90p
361.9
39.45
£ 42.56
September 2024
Night 10.90p
271.0
29.54
£ 30.49
August 2024
Night 10.90p
176.8
19.27
£ 20.00
July 2024
Night 10.90p
139.4
15.19
£ 15.97
June 2024
Night 10.90p
65.5
7.14
£ 7.81
May 2024
Night 10.90p
138.9
15.14
£ 15.87
April 2024
Night 10.90p
347.8
37.91
£ 41.58
March 2024 #
Night 10.90p
180.4
19.66
£ 22.18
(From 18 March 2024)
Day 27.98p
9.0
2.52
March 2024
Night 14.65p
266.9
39.10
£ 43.50
(Up to 17 March 2024)
Day 36.64p
12.0
4.40
March £ 65.68
February 2024
Night 14.65
495.7
72.62
£ 96.40
January 2024 #
Night 14.65p
508.9
74.55
£ 118.99
December 2023
Night 11.38p
540.3
61.49
£ 107.30
November 2023
Night 11.38p
502.5
57.18
£ 83.76
October 2023 #
Night 11.38p
478.8
54.48
£ 67.66
September 2023
Night 13.92p
328.2
45.68
£ 57.44
August 2023
Night 13.92p
335.1
46.64
£ 52.77
July 2023 #
Night 13.92p
299.4
41.67
£ 47.18
June 2023
Night 13.93p
201.9
28.12
£ 32.79
May 2023
Night 13.93p
162.1
22.58
£ 26.48
April 2023 #
Night 13.93p
402.3
56.04
£ 71.89
March 2023
Night 11.22p
583.7
81.31
£ 123.85
February 2023
Night 11.22p
547.6
61.44
£ 120.30
January 2023
Night 11.22p
420.8
47.21
£ 265.76
(Tesla installed 17th)
Day 49.38p
442.6
218.55
Tesla In Storm Watch Mode
Date
Info
EDF Free Savings
23/24-01-2025
Storm Eowyn
-
05-01-2025
Put into storm watch mode as EDF Free Electric 08:00 - 20:00
£ 3.38
29-12-2024
Put into storm watch mode as EDF Free Electric 08:00 - 20:00
£ 3.61
25-12-2024
Put into storm watch mode as EDF Free Electric 08:00 - 16:00
£ 1.90
6/7-12-2024
Storm Darragh
-
19/21-01-2024
Storm Isha
-
1/2-11/2023
Storm Ciaran
-
Notes : - Grid usage by month table
Powerwall consists of:- Tesla Powerwall AC 13.5kWh, Tesla Gateway 2 with backup power and Tesla 3 Phase Kit
Readings are updated manually following day from smart meter and exclude standing charge
E7 Night Rate times are GMT 00:00 to 07:00 and BST 01:00 to 08:00
E7 Day Rate times are GMT 07:00 to 00:00 and BST 08:00 to 01:00 following day
Tesla Powerwall installation completed 17th January 2023, effective from 18th
Tesla Powerwall 2 Past Graphs - Here
Had 5 power cuts since installation
Delay of approx 5 seconds before Tesla batteries provided back up power
18-05-2023 14:51 to 14:02, lasting justover 10 minutes, Cable feed to pole moved to underground feed
06-05-2023 20:30 to 23:55, lasting around 3 hours 25 mins
30-04-2023 Three powercuts between 22:15 - 22:50, each lasting less than 2 minutes
Page last updated
25th December 2024 - Added storm watch panel and notes panel
To do - Add view past history and set up 1 minute update to data.


 Feed
Feed Scan with QR Code Reader
 mobi
mobi


